
python、mosquitto、Home Assistantでスマートメーターから消費電力データを取得してグラフを表示しよう、という企画です。
概要はこちらの記事をご覧ください。

この記事では、Home Assistantを設定してグラフなどが表示できるようにします。
Home Assistantの設定
Home Assistantの設定ファイルに、mosquittoからデータを取得する定義を書き込みます。
「mqtt:」から下を追記します。
$ vi ha_config/configuration.yaml# Loads default set of integrations. Do not remove.
default_config:
# Load frontend themes from the themes folder
frontend:
themes: !include_dir_merge_named themes
automation: !include automations.yaml
script: !include scripts.yaml
scene: !include scenes.yaml
mqtt:
sensor:
# 瞬時電力 (W)
- name: "Smart Meter Instant Power"
unique_id: "smart_meter_instant_power"
state_topic: "home/smartmeter/instant"
unit_of_measurement: "W"
device_class: power
state_class: measurement
value_template: "{{ value_json.val }}"
# 積算電力量 (kWh)
- name: "Smart Meter Total Energy"
unique_id: "smart_meter_total_energy"
state_topic: "home/smartmeter/total"
unit_of_measurement: "kWh"
device_class: energy
state_class: total_increasing
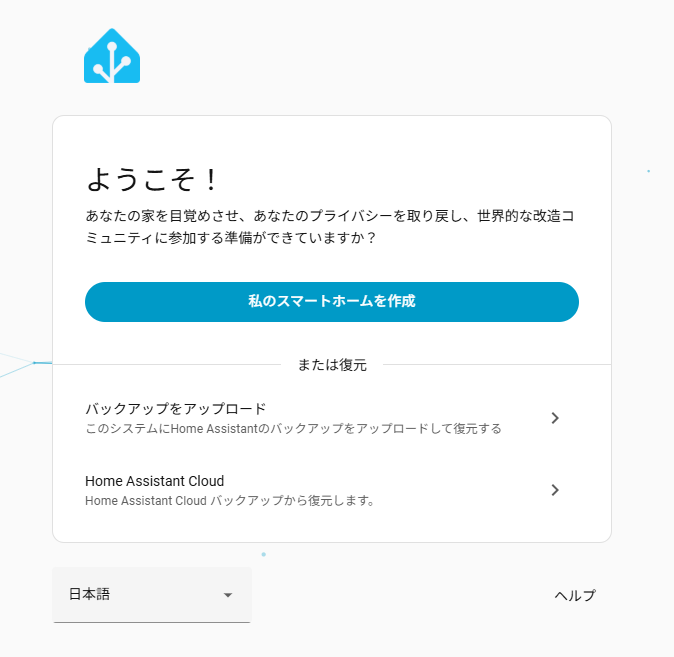
value_template: "{{ value_json.val }}"ブラウザで http://(Rock4C+のIPアドレス):8123 を開きます。
「私のスマートホームを作成」をクリックして、アカウントを作成します。
設定→デバイスとサービス を開きます。
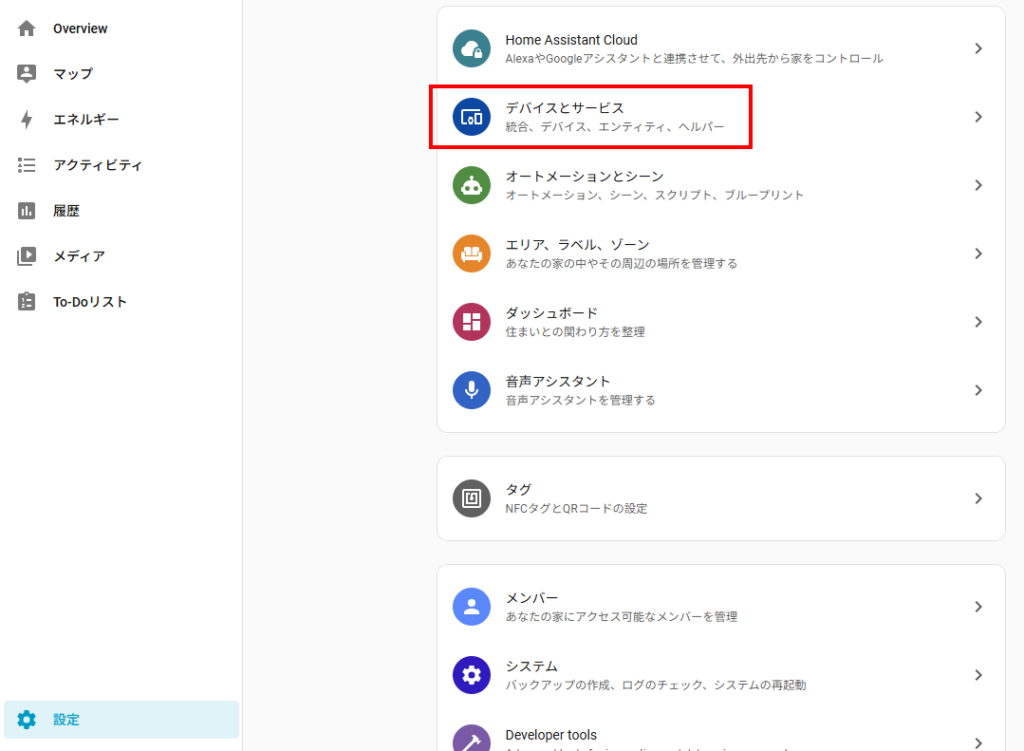
次の画面で、右下にある「統合を追加」をクリックします。
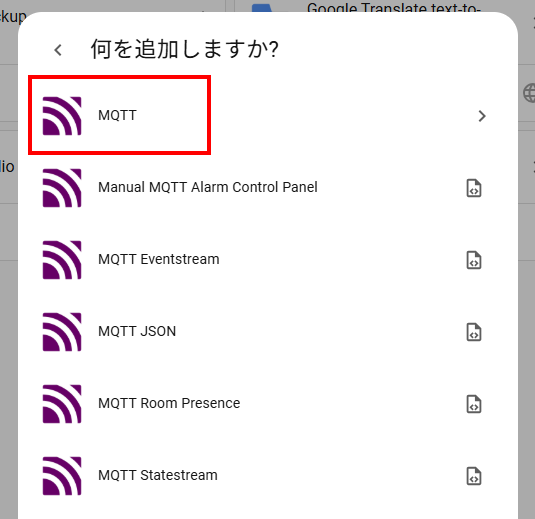
新しい統合の設定 ダイアログでMQTTをクリックします。(検索欄にmqと入力すれば出ます。)
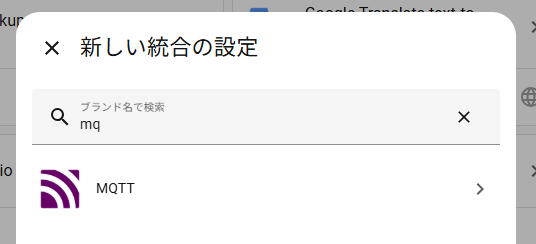
表示が変わるので、もう一度MQTTをクリックします。
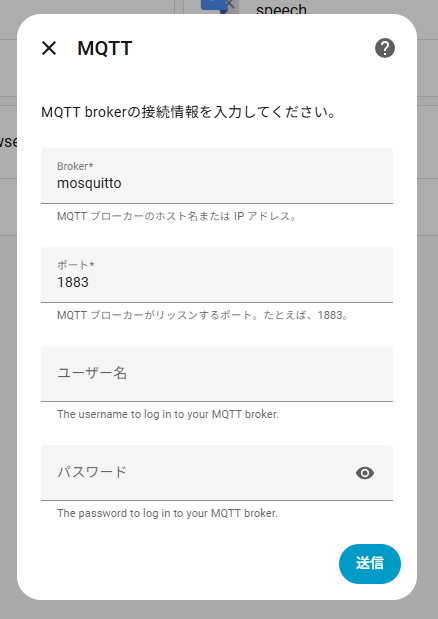
MQTTの接続情報を入力します。
Brokerにはコンテナ名を指定します。
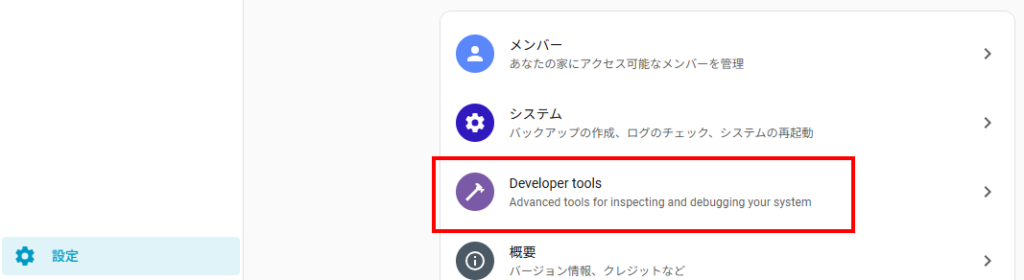
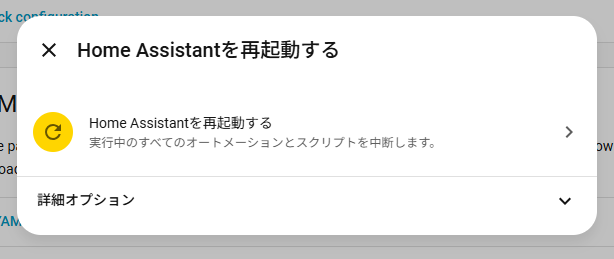
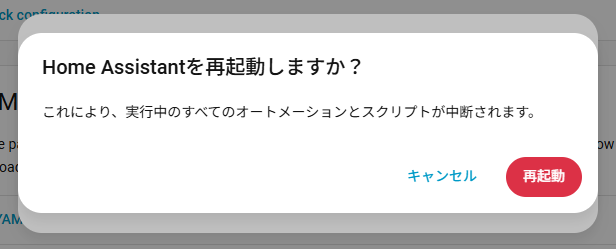
設定反映のためHome Assistantを再起動します。
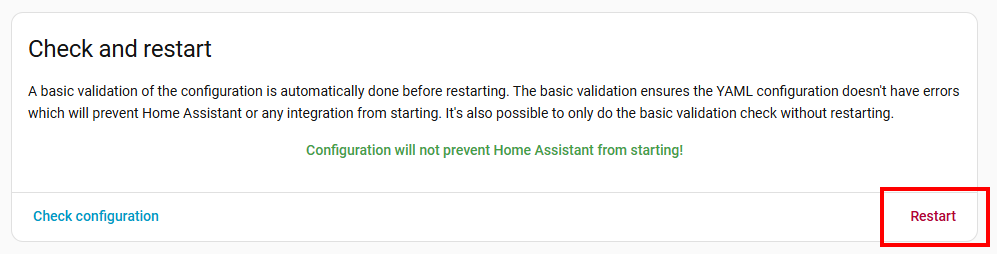
設定→Developer toolsを選択して、
Check and restart の Check configurationをクリックします。
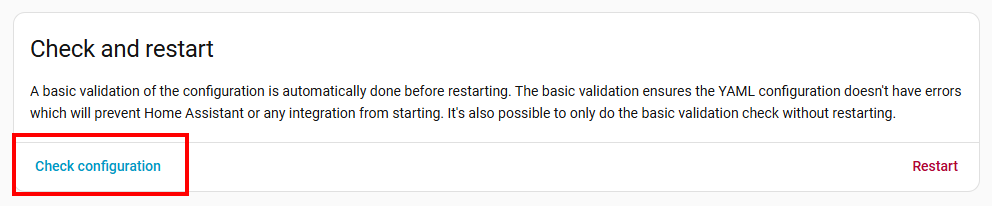
チェック結果が問題なければ再起動します。
続いてダッシュボードを設定します。
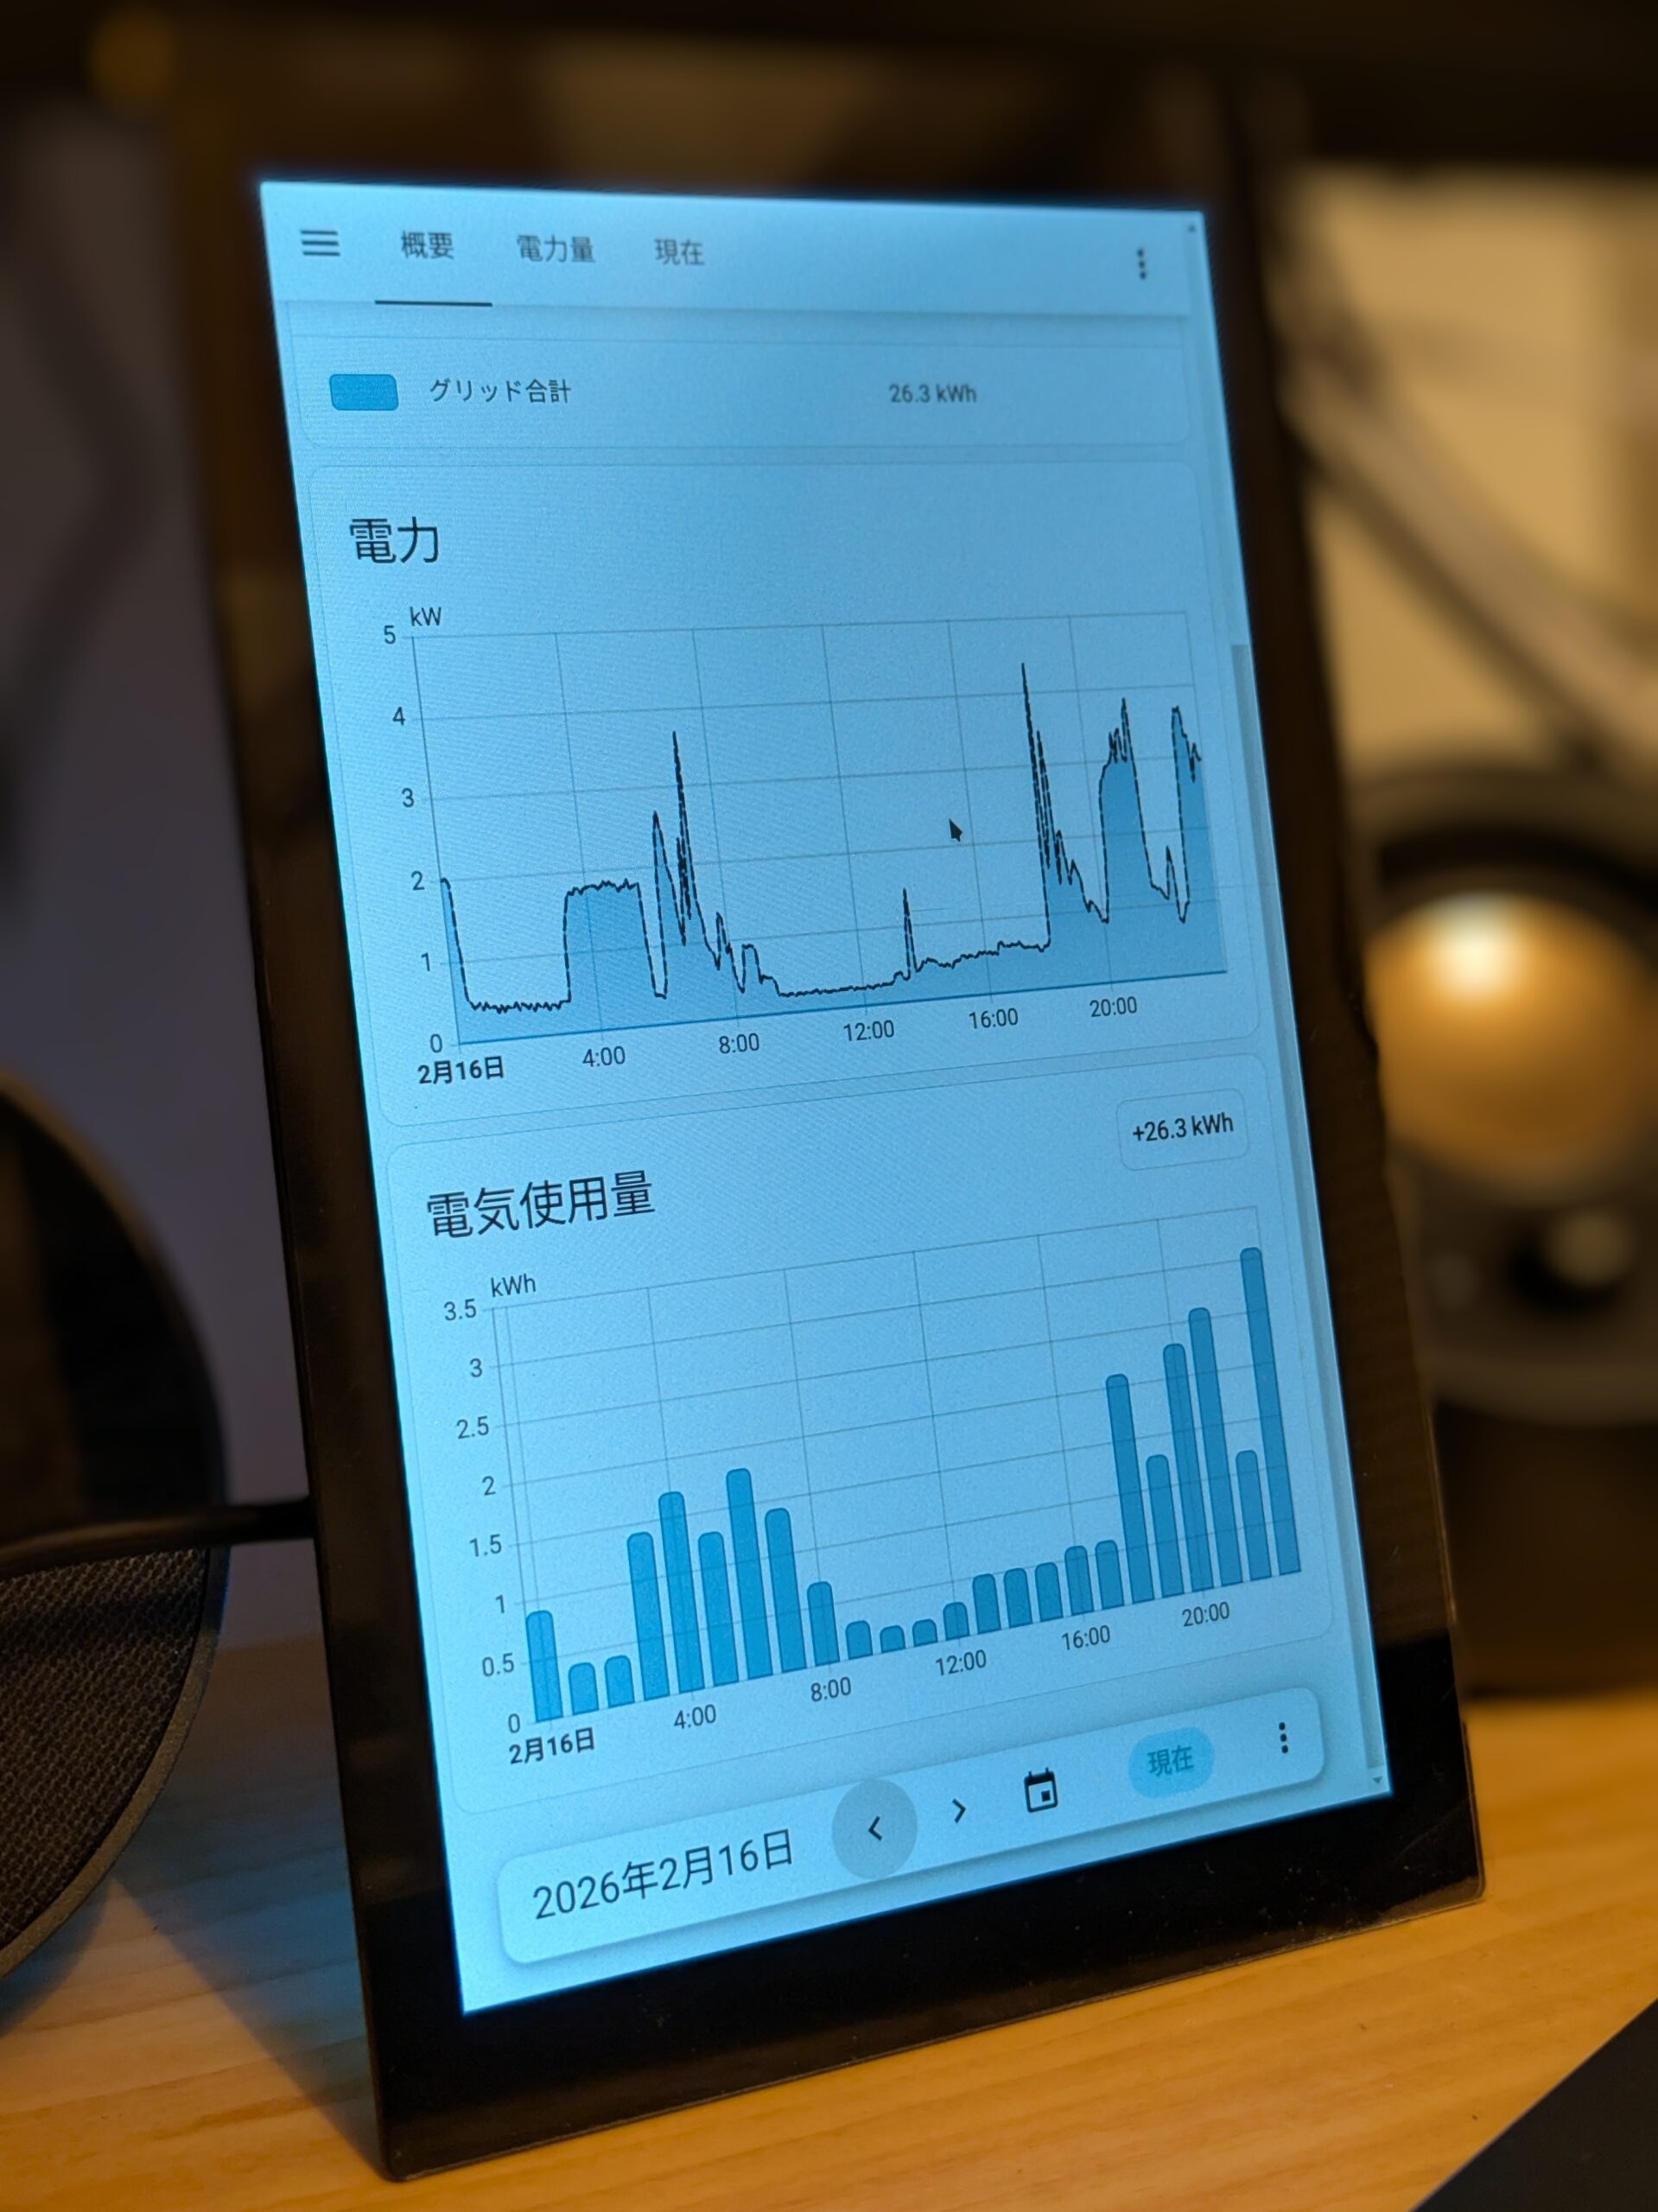
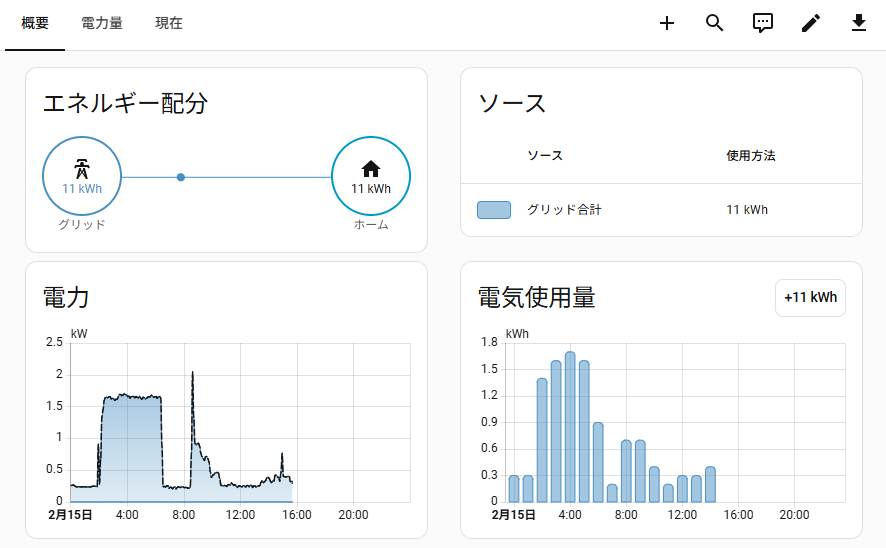
Home Assistant組み込みのエネルギーダッシュボードを使う場合はこんな感じです。
グリッド消費にSmart Meter Total Energy、系統電力にSmart Meter Instant Powerを使います。
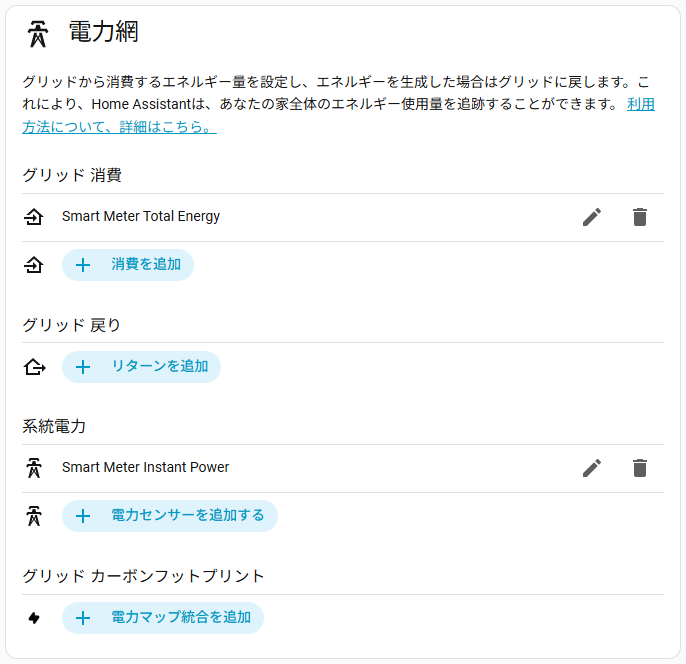
このように表示されます。
電気使用量のグラフはある程度データが溜まらないと表示されません。

コメント